

Charts are used to make information more readable and understandable.
Charts are used to make information more readable and understandable.

48
CURRENT RANK
CURRENT SCORE
less stats more stats21.30
Rank (best ever) 13
Score (all time) 251.00
Created 02/20/15
Views 201
Votes [disabled]
view list history

1

Pie Chart
Koolchart data visualization tool offers special animation features.
2

Bar chart
3

Line Chart
4
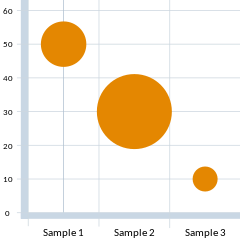
Bubble chart
5

Candlestick Chart
6
Histogram
7
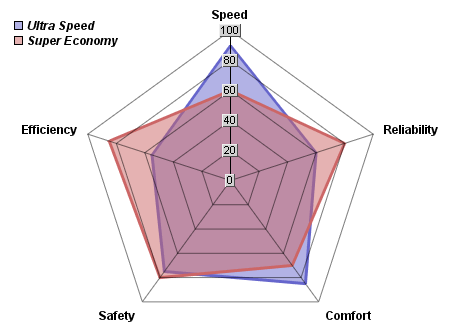
Radar Chart
8
Gauge
9

Plot chart
10

Area chart
[source: Chart Library ]
Not watching this list (get updates on this list).
(all people watching this list) ).
).

MORE LISTS


RECOMMENDED LISTS
COMMENTS